New online resources
You may not have seen many updates on Business Research Plus lately. That’s because we have been busy working on a new set of online resources…

The business data online resources are written to help students and researchers to make effective and accurate use of the specialist financial and business databases available at The University of Manchester. They are designed to help you to help yourselves, where possible.
If you find that these guides are not enough, you may wish to search Library Help for previous asked questions, or our blog Business Research Plus for older posts that go into much more detail.
How are the guides organised?
Visit the list on the Library website for an index of all the guides. They are organised into the following topics.
Welcome to Business Research Plus

From specialist databases to business literature, Business Research Plus provides advice and tips based on The University of Manchester Library Business Data Service resources and expertise. See our About page for more details.
- Library Research Plus provides expert insight from The University of Manchester Library’s Research Services for researchers in all disciplines including business.
- My Learning Essentials, the Library’s award-winning skills progamme includes online resources with a wealth of useful tips on searching, referencing, writing to support personal and professional development.
Exploring our resources – try the Business and Management Resources page (Subject Guides), scroll down to category or tag cloud in the right-hand column or search this blog (top right). For latest news see @UML_BDS Follow @UML_BDS
How do I access WRDS via SAS Studio?
Most of the time, databases in WRDS are accessed via the standard web interface. If you have an individual WRDS account, you may prefer to access the databases directly via SAS scripts. This will allow you to write large, efficient queries that combine data sets, then download just the resulting data. It is particularly useful for BoardEx which has many linked tables of data (for example, the gender of a person is kept in a different table to the employment history, linked by person ID). See SASsyFridays Introduction to SAS to learn more about the SAS.
You can access to WRDS via SAS in one of following ways:
- PC SAS on Windows
- SAS Studio
- WRDS Cloud (advanced)
Using PC SAS on Windows

PC SAS on Windows (image via WRDS)
WRDS provide a training exercise for PC SAS. It requires the use of a PC with SAS installed, such as the Eddie Davies Finance Zone, Humanities Bridgeford Street 2.1 and 2.2, and George Kenyon computer clusters.
Using SAS Studio
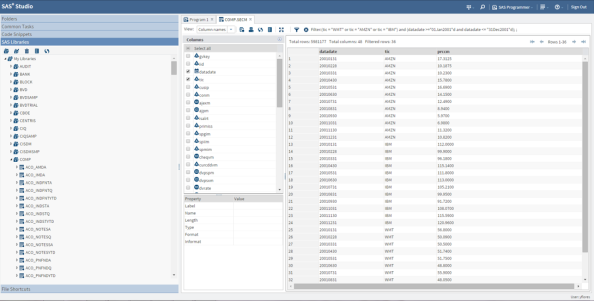
SAS Studio (image via WRDS)
WRDS provide a training exercise for SAS Studio. It works via the web. This is the newest method available and perhaps the easiest to configure.
Using WRDS Cloud (advanced)

WRDS Cloud accessed via the command line
PGR and academic researchers can write SAS scripts, upload them to run on the WRDS Cloud server then download the results. See our (slightly out-of-date) blog posts on WRDS Cloud for more details.
Using Eventus via SAS
One of the databases you can use via SAS is Eventus. There is a slight change of syntax that may be required if you use SAS Studio with the SAS data set containing the Fama-French factors:
-
Documentation says: Eventus Monthly FFF=FF.Factors;
-
Change for SAS Studio: Eventus Monthly FFF=ff.Factors_monthly;
Bloomberg monthly seminars for students 2019-20
 Last month the Bloomberg student monthly webinars resumed. Sign up and gain more insight into how to use the Bloomberg terminal. Please find below the dates and times (GMT) for the webinars planned for the rest of this year.
- 29/01/2020 : 12:00 PM
- 26/02/2020 : 12:00 PM
- 25/03/2020 : 12:00 PM
- 28/01/2020 : 12:00 PM
- 25/02/2020 : 12:00 PM
- 31/03/2020 : 12:00 PM
- 29/01/2020 : 1:00 PM
- 26/02/2020 : 1:00 PM
- 25/03/2020 : 1:00 PM
FX:
- 28/01/2020 : 1:00 PM
- 25/02/2020 : 1:00 PM
- 31/03/2020 : 1:00 PM
PORT:
- 30/01/2020 : 12:00 PM
- 27/02/2020 : 12:00 PM
- 26/03/2020 : 12:00 PM
- 30/01/2020 : 1:00 PM
- 27/02/2020 : 1:00 PM
- 26/03/2020 : 1:00 PM
Bloomberg Query Language (BQL), new API:
- 30/01/2020 : 11:00 AM
- 27/02/2020 : 11:00 AM
- 26/03/2020 : 11:00 AM
For students that are using the Bloomberg terminal to download data, the BQL seminar will be very useful in making sure they do this efficiently.
Once you sign up you will receive confirmation the following day after 9am GMT and will be able to join these using your personal laptops and computers.
Access to all webinars will be via meeting Link : bloombergslides.com/bbg4edu
Conference Access Code : 4842-0011
Bloomberg for Education Symposium 2019 highlights

Bloomberg cup and flyer
On 14 June 2019 I went to the annual Bloomberg for Education Symposium in London. It was a good way to keep up with developments in this highly regarded and utilised finance tool, plus a chance to network with other business librarians and academics.
I made extensive notes, too many topics to cover here, but I have summarised the highlights most relevant to our Business Data Service colleagues at The University of Manchester Library.
-
Bloomberg Market Concepts has been updated
-
BQL is set to improve Excel download efficiency
-
A few other things
1. Bloomberg Market Concepts has been updated
-
The online certification course Bloomberg Market Concepts (BMC) has a new module course titled ‘Portfolio Management’. This module covers the role of a portfolio manager, creating a portfolio, analysing historical performance, and evaluating future risk. It brings the total approximate duration of BMC to 12 hours, across five content modules plus the ‘Getting Started’ module.
-
The content across all the modules has been updated (56% of questions) to reflect changes in the sector.
2. BQL is set to improve Excel download efficiency
-
The traditional Excel commands to download Bloomberg data (such as BDP) often require users to download many data points to perform calculations. Such downloads commonly trip an institution’s daily or monthly download limits.
-
An extensive new query language BQL has been launched which allows for powerful expression building; you can run commands that are executed on the Bloomberg servers and download just the results you need. It will also help with creating historical constituent lists.
-
“BQL is the future for delivering data” says Gareth Jones, Regional Head of Application Specialists. So we (well, mostly me) should spend some time learning it and delivering it to students and academics.
3. A few other things
-
Case studies have been rebranded ‘Bloomberg Businessweek’ and individual titles can be assigned to different students in a class by their professor.
-
Python is the most useful programming language for data analysts working in Bloomberg, it is highly desirable for employability.
-
We looked at many news functions, including sentiment analysis from social media, natural language processing, and a weekly news quiz to play across your institution.
Creating indexes and constituent lists for industries in Datastream — EDSC manuals, tips & tricks
Creating indexes and constituent lists for industries in Datastream Worldscope (DW) Equity Datatypes A comprehensive set of new fundamental datatypes is now available for Datastream Global Equity indices and equities. The data is sourced from Worldscope and based on a trailing twelve month period if applicable. The data represents the sum of the relevant item […]
via Creating indexes and constituent lists for industries in Datastream — EDSC manuals, tips & tricks
Bloomberg monthly webinars for students
 Bloomberg have asked us to pass on the following details of monthly webinars aimed at training students to use several useful functions of the platform.
In efforts to provide further support for universities and to allow students to get training on Bloomberg across key market sectors, we has set up a series of monthly webinars that run the first Friday of every month.
- 8-9am – Bloomberg: Fixed Income for Students
- 8-9am – Bloomberg: FX For Students
- 9-10am – Bloomberg: Equity for Students
- 9-10am – Bloomberg: Commodities & Economics for Students
- 9-10am – Bloomberg: Portfolio analytics for Students
Students need to simply sign up to the sessions they wish to attend. Once they fill the form in, they will receive an invite to self select which slot they want within a week. Once confirmed, we will then send out the login details within 24 hours. If anyone signs up after the Tuesday prior to the Friday webinar, they will automatically be signed up for the following month.
The next session is Friday, 4 May 2018 (cut off: Tuesday, 1 May).

Dissertation Research
When seeking to complete a dissertation in the area of Accounting & Finance, a key consideration is ‘Research Feasibility’. This can be summarised by the statement:
Can I obtain the data I require, in a timely manner, to successfully complete my research?
A typical one year MSc course would allocate 3 months at the end, to complete the disseration. The gathering of company financial quantitative data, (from sources such as: Thomson Reuters Datastream, S&P Capital IQ, Bloomberg Professional, Compustat via WRDS: Wharton Research Data Service) is fundamental to the success of the research.
What can go wrong?
- Data is not available: It is not contained within the databases the university subscribes to. The years required are not covered. The student is off-campus and the data is only accessible on-campus (as is the case for Datastream and Bloomberg Professional).
- Research Proposal: This may be too ambitious. For example, a student reads an accounting/finance journal article and decides to try to replicate all or part of the research contained within the article. This can be problematic, as the academic probably spent two or more years completing the research – greater than the time available for an MSc dissertation.
- Topic: The choice of topic can be influenced by a desire to work in a particular area of finance. Unfortunately, this may lead to the key difficulty when conducting research – Data is Not Available.
Data is the foundation on which any analysis is based. Where this is difficult to obtain, time pressures may result, leading to the possibility of failure to submit the dissertation on time.
Whilst it could be argued that the difficulties experienced by students in working on their dissertation are part of the research process, as a Librarian, my approach is different: how can I be most helpful, in assisting the student to successfully complete their research?
Helpful Suggestions
- Pilot Project: Essentially this means establishing the best source – there could be more than one available. Also, how to search the source productively. Also, whether all the years of data required are covered.
- Seek Guidance: This follows directly from point one above. It may be that the most efficient method (shortest time to collect what is required) is not known to the student. Guidance from a Librarian can demonstrate the best source and search method, drawing on years of experience in supporting student dissertation research.
- Explore Resources: With so many sources available to students, the difficulty is often one of familiarity – knowing which databases are available and how they can be accessed. A Library web site is a good place to start. The example below is the subject guide for ‘Business and Management’, at the University of Manchester.

Business & Management Guide
One of the sections is for ‘Specialist financial databases’. These are useful for dissertation research:
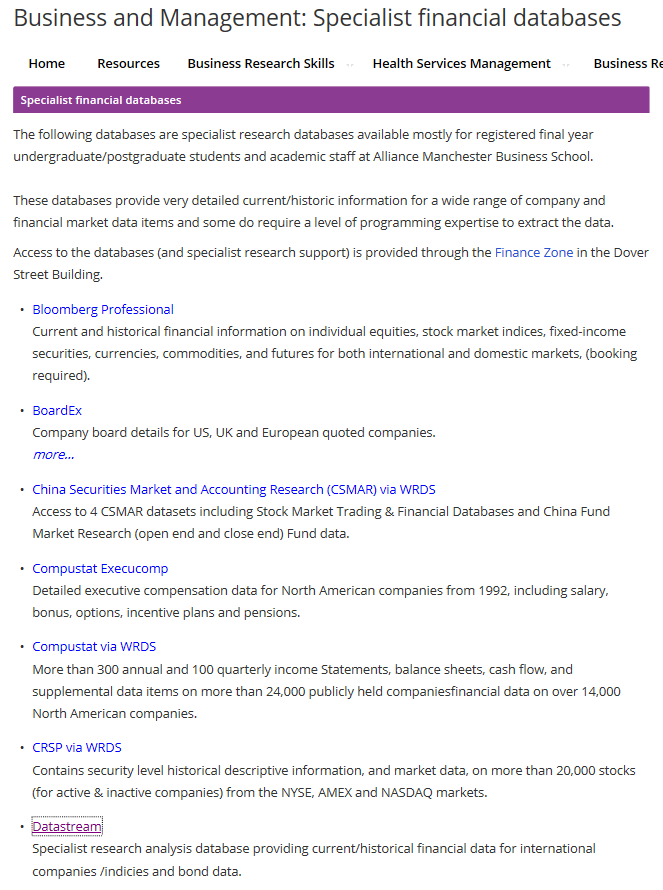
Specialist Databases
Summary
Making the best use of resources by seeking guidance from Librarians and planning ahead (pilot study) can help to ensure a dissertation is successfully completed. The key factor being, the ability to secure data, on which to base any analysis.
Previous related post, in the Library Research Plus blog:
Research Feasibility [18 February 2015]
13 new ESG Scores released on Datastream
The following message is copied directly from Thomson Reuters content notification DN093509. It applies to Thomson Reuters Datastream, specifically Environmental, Social and Governance (ESG) data. There has been no change in the ASSET4 Excel template which can be used to access this data. The 2015 ASSET4 ESG data glossary (Excel format) offers an additional reference of the relevant datatypes. A copy of this message is also available as a PDF.
Thirteen new ESG Scores measures have been added to Datastream.
Thomson Reuters ESG Scores are an enhancement and replacement for the existing equally weighted ASSET4 ratings*. They reflect Thomson Reuters’ new strategic ESG framework.
* NB: We advise all users of the ASSET4 ratings to migrate to the new ESG Scores in the coming months, as we plan to retire the ratings in early 2018.
Key enhancements over the legacy equal-weighted ASSET4 ratings are:
- ESG controversies overlay
- Industry and Country benchmarks at the data point scoring level
- Automatically adjusted Category scores based on the size and impact of each category
- Percentile Rank scoring methodology where hidden layers of calculations are eliminated
The new scores are designed to transparently and objectively measure companies’ relative ESG performance across ten themes as shown in the chart below.

A combination of the ten categories makes up the ESG Score, which is discounted when there were ESG controversies to calculate the ESG Combined Score. Where there were no controversies for a particular period, the ESG Combined Score and ESG Score have the same value. The ESG Controversies score is calculated per fiscal period, with the latest controversies being reflected in the latest complete period.
Thomson Reuters ESG Scores are calculated and available for all companies and historical fiscal periods in the ESG Global Coverage, consisting of 6,000+ public companies globally.
Below are the corresponding Datastream datatypes, titles and definitions.
| DS Datatype | DS Title | DS Definition |
|---|---|---|
| TRESGS | ESG Score | ESG Score is an overall company score based on the self-reported information in the environmental, social and corporate governance pillars. |
| TRESGCS | ESG Combined Score | ESG Combined Score is an overall company score based on the reported information in the environmental, social and corporate governance pillars (ESG Score) with an ESG Controversies overlay. |
| TRESGCCS | ESG Controversies Score | ESG Controversies Score measures a company’s exposure to environmental, social and governance controversies and negative events reflected in global media. |
| TRESGENRRS | Resource Use Score | Resource Use Score reflects a company’s performance and capacity to reduce the use of materials, energy or water, and to find more eco-efficient solutions by improving supply chain management. |
| TRESGENERS | Emissions Score | Emissions Score measures a company’s commitment to and effectiveness in reducing environmental emission in the production and operational processes. |
| TRESGENPIS | Environmental Innovation Score | Environmental Innovation Score reflects a company’s capacity to reduce the environmental costs and burdens for its customers, thereby creating new market opportunities through new environmental technologies and processes or eco-designed products. |
| TRESGCGBDS | Management Score | Management Score measures a company’s commitment to and effectiveness in following best practice corporate governance principles. |
| TRESGCGSRS | Shareholders Score | Shareholders Score measures a company’s effectiveness in the equal treatment of shareholders and the use of anti-takeover devices. |
| TRESGCGVSS | CSR Strategy Score | CSR Strategy Score reflects a company’s practices to communicate that it incorporates the economic (financial), social and environmental dimensions in its day-to-day decision-making processes. |
| TRESGSOWOS | Workforce Score | Workforce Score measures a company’s effectiveness towards job satisfaction, healthy and safe workplace, maintaining diversity and equal opportunities, and development opportunities for its workforce. |
| TRESGSOHRS | Human Rights Score | Human Rights Score measures a company’s effectiveness in respecting the fundamental human rights conventions. |
| TRESGSOCOS | Community Score | Community Score measures the company’s commitment to being a good citizen, protecting public health and respecting business ethics. |
| TRESGSOPRS | Product Responsibility Score | Product Responsibility Score reflects a company’s capacity to produce quality goods and services, incorporating the customer’s health and safety, integrity and data privacy. |
The ESG Controversies Score is calculated based on 23 ESG controversy topics and measures a company’s exposure to environmental, social and governance controversies and negative events reflected in global media
For more details, you can click here to refer to the full methodology paper. In particular, you can consult page 12 for a high-level comparison between the two scoring methods.
Updated conditional statements feature in WRDS

An example of nested conditional statements, taken from WRDS help pages.
Wharton Research Data Service (WRDS) is praised for offering a consistent user interface across the many databases that it houses, so, when a new search feature is released, it will be available for all users. They have updated the conditional statements builder and made it more powerful and easy to use. We will look at Compustat Global in this example.
What is the conditional statement builder?
To quote WRDS support, you can “build unlimited conditional statements using the list of variables, comparison operators, desired values, and logical operators”. The conditional statement builder still forms part of Step 2: Apply your company codes, but you will need to come back after completing Step 3 Query variables before it will work.
How do I use the conditional statement builder?

As before, you can choose to select companies individually, upload a list, or “Search the entire database”. Choose this last option if you wish to use the conditional statement builder to reduce the scope of your search using any query variable. For example, you may want to search for companies located in one country, or those with total assets over a threshold, or those in a particular sector. Note that you will need to include the relevant query variable in Step 3: Query variables before applying the conditional statement builder.

Scroll back up to Step 2, click “Activate Conditional Statement Builder”.

Add rules one at a time, selecting one of the chosen query variables and a condition (equals, not equals, greater than, begins with, and so on). You can choose to join with AND or OR logical operators. You can add groups of statements and join them.

What help is available?
You must take care to use the right units, scale and codes. To check the acceptable values to use, check the Variable Descriptions tab at the top of the page, or perform a small search and look at the kind of results it gives.
There is a short help page by WRDS on conditional statements, click the link labelled “How does this work?” above the builder.
Getting a linking table from Compustat via WRDS Cloud using SSH and SAS
Researchers commonly need to combine data from multiple sources. Even when the sources are offered through the same platform such as Wharton Research Data Service (WRDS), this can still be a difficult process with many choices. Essentially, you need to find a common entity identifier in both sources; if none exists, find a reference table or other third source.
The help provided by WRDS is often sparse in detail and tailored for their more advanced users. I have previously written in detail about using WRDS Cloud and SAS to gain access to resources not available on the WRDS website, in the blog post Getting S&P 500 constituents from CRSP via WRDS Cloud using SSH and SAS.
In this post, I will suggest a way to link I/B/E/S data with Compustat North America data. I will summarise the points that are addressed in the aforementioned blog post.
Get a linking table from Compustat North America
You will need the following to begin.
- AUTHENTICATION. Your WRDS username and password, specifically an individual PGR or Academic login.
- SENDING COMMANDS. Windows users: the Putty program. Mac/Linux users: the Terminal app or command line.
- FILE TRANSFER. Windows users: WinSCP or FileZilla. Mac/Linux users: CyberDuck or FileZilla or command line.
- FILE EDITING: Notepad, Notepad++ or another text editor. Excel or other spreadsheet application.
The method is very similar to getting the S&P 500 constituents. Essentially, Compustat has a dataset called securities which lists all the identifiers for all the securities. It is in SAS format. It cannot be accessed directly by us, but we can write a SAS script to read its entire contents to a plain text file, then copy the file to our own PCs. This file is kept at location /wrds/comp/sasdata/d_na/security/security.sas7bdat for North American data and is updated often.
Your script to read this file should look like this:
options nosource nodate nocenter nonumber ps=max ls = max;
title ' ';
options source;
proc print data=comp.security noobs width=UNIFORM;
This is different from last time in a few ways.
- The ‘ls’ or ‘line size’ option has been changed from ’72’ to ‘max’. This is because there are more columns for Compustat securities than for S&P 500 constituents.
- The data table we are reading from is ‘data=comp.security’.
- The ‘labels’ option has been removed so we get the clean variable names as the header.
- The ‘width’ option is set to ‘UNIFORM’ so the columns are the same number of characters wide on each ‘page’.
The method is as follows; remember to refer to the aforementioned blog post.
- Save the SAS script to a new text file on your computer, compsecurity.sas or similar.
- Use WinSCP or equivalent to copy this file to your own space on WRDS Cloud.
- Use Putty or equivalent to run the script, log in and type qsas compsecurity.sas and press Enter.
- Wait 10 seconds and use WinSCP to download the generated files compsecurity.log and compsecurity.lst to your computer. The ‘lst’ file contains the data, if the program was successful (read the ‘log’ file to check).
- Use Notepad++ or equivalent to remove the blank lines from the top of compsecurity.lst and save it as compsecurity.txt – then check every 32,764 lines for a few more blank lines and repeat of the headers to be removed (these are ‘page breaks’).
- In Excel, open compsecurity.txt (via Data > Get External Data from Text) and use fixed column width option, carefully setting the locations for the column breaks, remembering to set most columns as Text format instead of General (particularly GVKEY and CUSIP). Save as CSV or Excel format.

Using the linking table
You will need the columns GVKEY and IBTIC (IBES Ticker).
- If your Compustat and I/B/E/S data are in Stata format, import this table and consider joining the tables.
- If your Compustat and I/B/E/S data are in Excel format, use VLOOKUP formulas (some more processing may be required).
Still to do: there is not necessarily a one-to-one match between these two identifiers. The same GVKEY will appear on more than one row, but will those rows contain more than one unique ticker? And is the data frequency the same in each source? You will need to find the answers to these questions out for yourself.

Referencing tips

